Your browser does not support javascript.
Please enable javascript support or use a compatible browser.
Needing anything?
Log In
Identificação
Perfil Professor ·Insira abaixo sua senha de identificação que recebeu por e-mail.
Enter your email
Sent with success!
Seu relatório foi enviado com sucesso.
You've been gone three minutes away!Time stopped counting.Press the button below to return.
|
5th Grade
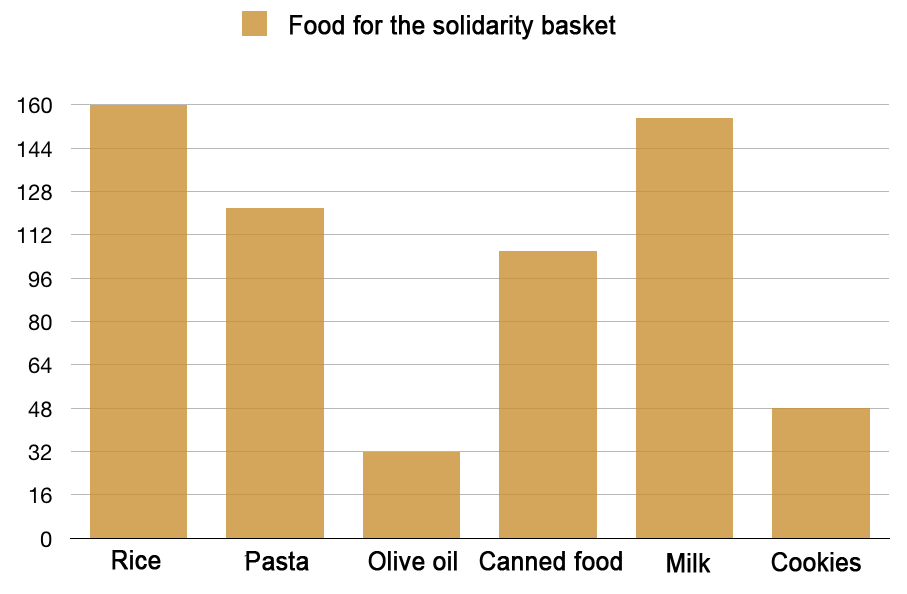
Representation and interpretation of data - Bar graphs
0%
What is the most collected food for the solidarity basket?
Milk
Rice
Olive oil
Cookies
Invalid birthdate